
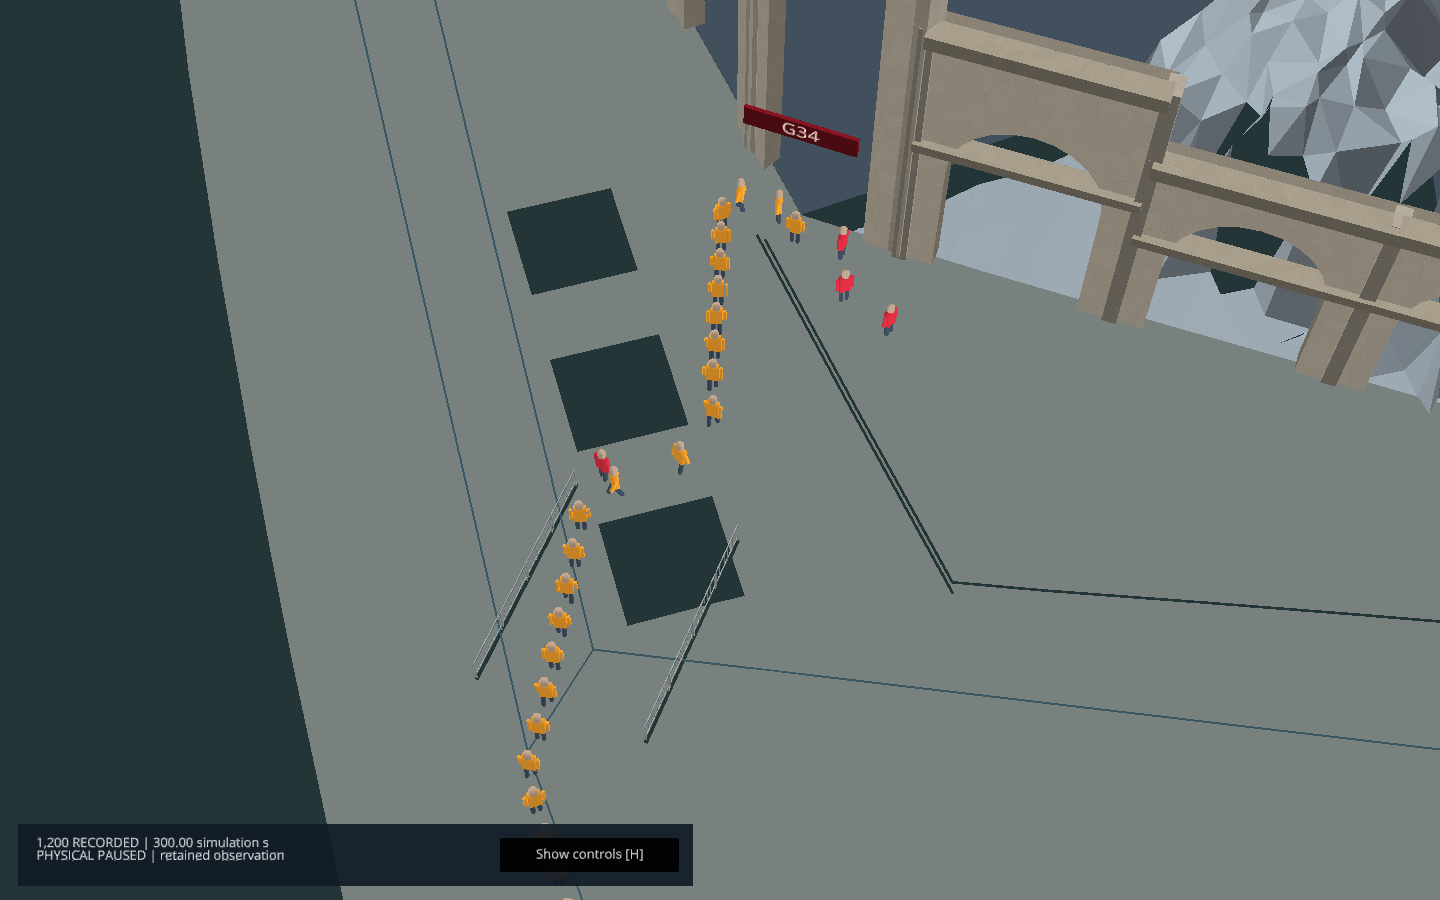
See how people move.
Test the plan before the event.
Pedestrian simulations for venues, event centers and event organizers. Explore how people arrive, enter, circulate and leave—then compare the options that shape your next decision.
Start with the operating question
A clear plan.
A closer look at movement.
A layout can look clear on paper and behave differently when people arrive together, pause, queue, cross paths or head for the same exit.
CrowdSafe Movement brings those interactions into view. We build scenarios around your site, audience and operating plan to help identify potential constraints and compare practical changes before you commit.
Latest model views
Make movement visible.
Model views from Ohio Stadium and Boch Center’s Wang Theatre bring stadium context, screening interfaces and seating-level relationships into focus.
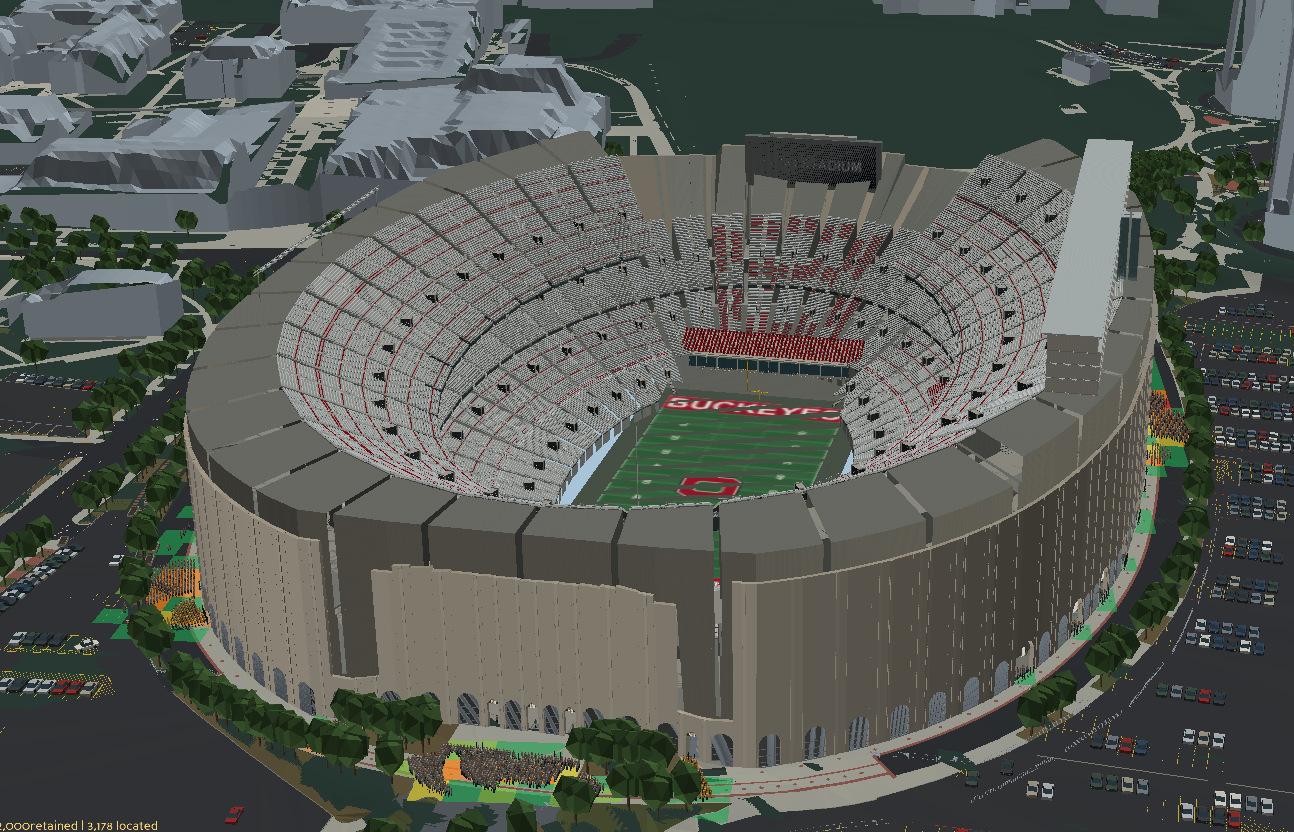
Ohio State · Ohio Stadium
North-side model view
See the stadium in context.
Ohio Stadium — a north-side model view showing the closed horseshoe facade, seating bowl and surrounding campus. Geometry and crowd positions reflect the source model’s assumptions; the image is presented as a planning preview.
Image: CrowdSafe Group.
View full-size image (new tab)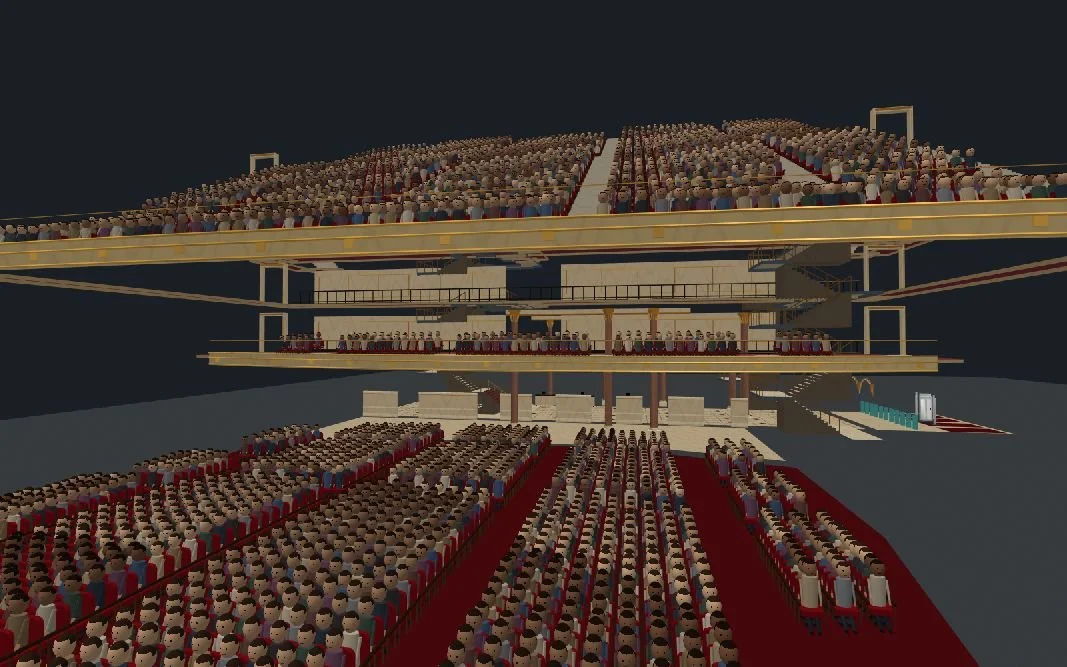
Boch Center · Wang Theatre
Auditorium · Front-right stage perspective
See the seating from the stage.
Boch Center’s Wang Theatre — an elevated front-right stage perspective toward the modeled main floor and upper seating tiers. This illustrative planning reconstruction brings audience seating, row depth and the relationship between levels into view.
Image: CrowdSafe Group · CrowdSim 2 / Wang Theatre revision C.
View full-size image (new tab)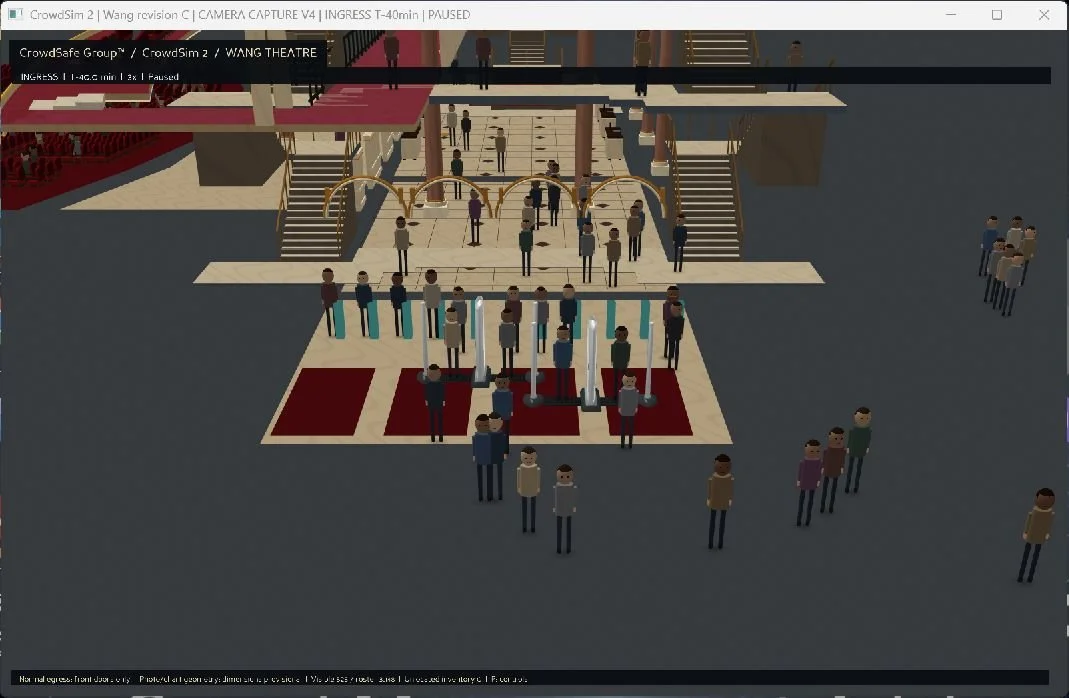
Boch Center · Wang Theatre
Ingress · Front screening
Explore the arrival experience.
Boch Center’s Wang Theatre — ingress through the front screening area in the current planning reconstruction. The close view brings entrance lanes, lobby connections and stairs into focus.
View full-size image (new tab)These are current scenario-based model screenshots. Wang Theatre is an illustrative planning reconstruction; venue geometry remains provisional. Findings depend on the geometry, demand, behavior and operating assumptions used; a visualization alone does not establish capacity or guarantee safety.
Inside the analysis
Read the patterns.
Test the choices.
Selected planning examples from CrowdSafe Group™ connect an arrival profile with service-stage waits and queue timing. Each chart identifies what was specified, what was calculated and which decision the result can help your team examine.
Model inputs describe the demand or conditions specified. Planning calculations and simulation results describe what the identified analysis produces.
01 / Arrival profile
See when the demand concentrates.
A time profile gives the entry plan a defined workload. Here, the input releases 3,148 modeled people from a conceptual local approach in the hour before curtain.
2,203 of 3,148 modeled arrivals fall in the final 30 minutes—about 70% of the input demand.
The final 15 minutes alone contain 1,259 people. This is an assumed demand pattern to test against the operating plan, rather than an observed venue arrival survey.
Decision to testCompare a more concentrated arrival profile or a different opening plan while keeping the population and service assumptions explicit.
Source: CrowdSafe Group, Wang Theatre illustrative planning example; saved ingress schedule, 27 October 2026; reviewed 28 October 2026. Series: saved arrival clocks, grouped into 15-minute intervals.
Source, definitions and exact values
Arrival means release from a conceptual short local exterior origin/approach. It does not mean arrival at a transport station, the venue door or a screening server. Nominal interval shares are 10%, 20%, 30% and 40%; the displayed whole-person counts sum to 3,148.
Source revision: retained calendar mass-normal-egress-r01, used by the revision C viewer. The camera revision does not change these saved arrival or service clocks. The supporting evidence is the reviewed 28 October 2026 extraction of the retained calendar and service-event ledger.
Intervals are left-inclusive and right-exclusive, with no arrival at the final right edge. Within each interval, uniform midpoint clocks are assigned to model identities by a seeded permutation. The first three counts are rounded and the final interval takes the remainder.
The modeled population is the 3,148 assigned people. A historical 3,600-place planning roster contains 452 unassigned places that are excluded from this example.
No measured audience-arrival survey or ticket-scan arrival distribution is established by this source.
| Minutes before curtain | Assumed arrival input (People per 15-minute interval) |
|---|---|
| 60–45 | 315 |
| 45–30 | 630 |
| 30–15 | 944 |
| 15–0 | 1,259 |
02 / Queue wait times
Separate the waits at each service stage.
Waiting before service is different from time spent being served or walking to the next stage. A distribution makes the longer waits visible alongside the typical record.
Primary screening has a 95th-percentile wait of about 2 minutes 56 seconds in this schedule.
Its median wait is about 1 second and its maximum is about 3 minutes 23 seconds. Ticket validation has little scheduler wait under the assumed arrangement; that does not describe the total journey to a seat.
Decision to testChange the primary service arrangement or arrival timing in a matched scenario, then check whether delay moves to a later stage.
Source: CrowdSafe Group, Wang Theatre illustrative planning example; saved ingress schedule, 27 October 2026; reviewed 28 October 2026. Series: saved service-ready arrival and service-start records.
Source, definitions and exact values
Waiting time = service-start clock minus the resource’s service-ready arrival clock. It excludes service duration, walking, branch-transfer allowances and other stage waits. Percentiles use the complete saved records, including zero waits, with linear interpolation. Display values are rounded to 0.001 second.
Source revision: retained calendar mass-normal-egress-r01, used by the revision C viewer. The camera revision does not change these saved arrival or service clocks. The supporting evidence is the reviewed 28 October 2026 extraction of the retained calendar and service-event ledger.
Primary screening: 3,078 people. The separate Will Call route has 50 people and the accessible screening route has 20, together covering all 3,148 modeled people. Ticket validation includes all 3,148. Secondary screening covers 189 referred people who overlap the screening cohorts (185 primary, 2 Will Call and 2 accessible); these stage samples must not be added as independent crowds.
The saved scenario assumes four primary passages at 1,000 people/hour each, eleven ticket servers at 500 people/hour each, two secondary servers with 30-second service and a 6% referral share. These are unmeasured planning assumptions, not verified installed equipment or sustained venue throughput.
A 95th-percentile value describes the distribution of the saved stage waits. It is not a mean, a service standard or a promised wait for a real event.
The service configuration and rates are unmeasured. This is an illustrative first-in, first-out schedule, not a calibrated physical queue or observed venue performance.
| Service stage | Median (Waiting before service (seconds)) | 95th percentile (Waiting before service (seconds)) | Maximum (Waiting before service (seconds)) |
|---|---|---|---|
| Primary screening | 1.056 | 175.656 | 203.241 |
| Secondary screening | 14.564 | 67.504 | 83.502 |
| Ticket validation | 0 | 0 | 0.454 |
03 / Queue build-up and clearance
Follow the queue beyond the arrival window.
The last arrival-input clock does not mark the end of the entry journey. This detail follows people waiting for primary screening from 20 minutes before curtain to 10 minutes after.
The logical primary-screening queue peaks at 226 people about 1 minute 16 seconds after curtain.
In the final five minutes before curtain, 404 people reach the primary service-ready clock while 333 start service. The waiting count rises from 132 to 203 at curtain, then peaks later as the journey continues.
Decision to testTest arrival timing and service arrangements together, and follow the result through ticket validation and onward movement rather than stopping the analysis at curtain.
Source: CrowdSafe Group, Wang Theatre illustrative planning example; saved ingress schedule, 27 October 2026; reviewed 28 October 2026. Series: resource-ledger waiting counts at five-minute boundaries, plus the exact first event peak.
Source, definitions and exact values
This is a logical service-ready waiting count: a person’s resource-arrival clock is at or before time t and their service-start clock is later than t. People whose service has started and other resources are excluded. Separate travel and transfer states are not a physical queue count. Five-minute boundary values are joined as a visual guide; the amber point is the first exact event peak, at 75.811279 seconds after curtain.
Source revision: retained calendar mass-normal-egress-r01, used by the revision C viewer. The camera revision does not change these saved arrival or service clocks. The supporting evidence is the reviewed 28 October 2026 extraction of the retained calendar and service-event ledger.
The graph is a detailed time window. Earlier five-minute samples, from 60 to 20 minutes before curtain, have zero primary-resource backlog. The five-minute sample at +5 minutes is zero; this does not establish a physical queue footprint or a safe holding population.
During the final three pre-curtain five-minute intervals, primary service-ready arrivals are 382, 411 and 404 people, while service starts are 328, 333 and 333. The accumulated waiting counts at the interval ends are 54, 132 and 203.
The saved scenario assumes four primary passages at 1,000 people/hour each, eleven ticket servers at 500 people/hour each, two secondary servers with 30-second service and a 6% referral share. These are unmeasured planning assumptions, not verified installed equipment or sustained venue throughput.
This is a logical scheduler backlog rather than a calibrated physical queue. It does not establish available holding space, outdoor capacity or a density measurement.
| Minutes relative to curtain | Waiting people · five-minute samples + exact peak (People waiting) |
|---|---|
| -20 | 0 |
| -15 | 0 |
| -10 | 54 |
| -5 | 132 |
| 0 | 203 |
| +1m16s | 226 |
| +5 | 0 |
| +10 | 0 |
Evidence for your design and operations teams
A useful study leaves your team with more than a video.
Depending on the question and agreed scope, your study can include:
Arrival profiles and demand windows
Time-binned demand, population reconciliation and sensitivity tests for concentrated arrivals, delayed opening or changed event timing. Observed evidence and assumed profiles stay distinct.
Service-stage and queue analysis
Stage-specific waiting distributions, queue build-up and clearance, and comparisons of agreed service arrangements. Queue population, waiting time and physical holding space are reported separately.
Location-specific circulation findings
Supported route, merge, stair and shared-space findings, with the place, time and duration of each concentration. Density is reported only where its usable-area and trajectory basis supports it.
Journey milestones
Clear arrival, entry, seat or destination milestones for the modeled journey. A result at one checkpoint is distinguished from end-to-end readiness, onward dispersal and accessible journeys.
Comparable scenarios and practical tests
Matched comparisons of the agreed layouts or operating plans, showing which assumptions change, which constraints remain and what needs further observation or testing.
An evidence and assumptions record
Readable charts, metric definitions, source references and the limitations that affect each conclusion, supported by an action-focused briefing for the people making the next decision.
These examples are scenario-specific. Findings depend on the demand, geometry, behavior and operating assumptions used. They inform the next design or operating test; they do not establish an approved capacity or guarantee safety. Discuss your event’s movement question ↗
Analysis and presentation © 2026 THE CROWDSAFE GROUP, LLC. All rights reserved.
What we can examine
Test the decisions that change the journey.
Arrival and entry
Compare arrival patterns, gate arrangements, security screening and ticketing. Examine where demand may exceed processing capacity.
Queues and waiting areas
Explore queue formation, waiting space and spillback. Test how service arrangements affect nearby walking routes.
Circulation and shared spaces
Review concourses, lobbies, stairs and crossings, including interactions around concessions, amenities and accessible journeys.
Exit and onward movement
Follow departure routes toward surrounding streets, parking, pickup areas and transport connections. Examine downstream constraints.
Layouts and contingencies
Compare event configurations and agreed disruption scenarios, such as an unavailable route, delayed opening or concentrated arrival peak.
From question to practical findings
A study built around your decision.
Agree the question.
Review plans, audience needs, expected demand, operating arrangements and available evidence. Set the study scope and the scenarios to compare.
Build and test.
Develop the movement model and examine the agreed conditions. Test how key assumptions affect the findings and the options under consideration.
Turn findings into actions.
Explain constraints, tradeoffs and uncertainty. Identify practical changes, further observations and priorities for your design and operating teams.
Evidence your team can use.
Deliverables are agreed to suit the question.
Your study may include movement visualizations, scenario comparisons, location-specific queue and route findings, an assumptions and limitations record, and a practical briefing with recommendations.
Your next venue. Your next event.
Bring us the movement question.
Share your venue or event, the plans available, your timing and the decision you need to make. We’ll help define an appropriate pedestrian simulation study.